

Natural Resource Inventory and SWAP
Incorporating the NH Wildlife Action Plan Into a Natural Resource Inventory
A natural resource inventory (NRI) identifies and describes natural resources in a given locale.
Natural resources can be defined as critical resources supplied by nature that are irreplaceable or very expensive to replace if used up or destroyed. Examples of natural resources are soils, wetlands, other habitats, water, plants, and wildlife. It is important to identify these resources for the health and well being of New Hampshire residents. You may have already experienced the effects of lost natural resources by noticing loss of open space and recreational areas, contamination of ground and surface waters, less diversity of wildlife, and increased erosion and flooding.
To protect these natural resources, it is essential to first identify, map, and describe where on the landscape they currently exist.
Many communities have recognized the need for conservation planning, and conducting a natural resource inventory or "NRI" is the first step in doing so. An excellent guide on conducting a natural resource inventory is Natural Resources Inventories: A Guide for New Hampshire Communities and Conservation Groups PDF Document revised and updated by Amanda Stone (2001). It can be downloaded from the University of New Hampshire's Cooperative Extension Program.
The State Wildlife Action Plan is an excellent source of information on wildlife and habitats that can easily be incorporated into an NRI. The SWAP identifies habitats and species in greatest need of conservation, identifies threats to their continued existence, and offers strategies to address these threats statewide.The following are suggestions on how to incorporate the WAP into an NRI:
Wildlife Habitat Land Cover Map
 Use this map to help identify the different types of habitat that can be found in your area. 21 habitats were mapped statewide using GIS and are available for use in any GIS program. Wildlife habitat land cover maps can be found on the GRANIT website (NH GRANIT (unh.edu)) by searching “Wildlife Action Plan” on the New Hampshire Geodata Portal, and on GRANITView (GRANITView (unh.edu)) under the “Environment and Conservation”, “Wildlife”, and “Wildlife Action Plan” layers. For more information, visit the habitat mapping page
Here is a Wildlife Habitat Land Cover Map for the town of Barrington. The more common habitat types are Appalachian Oak Pine in brown, Hemlock Harwood Pine in green, and Grassland in orange. These maps were created using statewide data, so to get habitat land cover data on a more finite scale, such as a town forest or your backyard, you should do an on-the-ground search.
Highest Ranked Wildlife Habitat by Ecological Condition Map
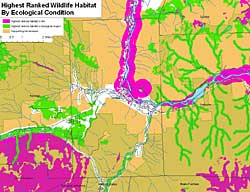 This statewide map helps to identify where on the landscape a particular patch of habitat has good biological diversity (particularly in terms of rare species), is connected to other similar patches in the landscape, and is not highly impacted by humans. The highest ranked habitat in NH, highest ranked habitat in biological region, and supporting landscape are mapped in GIS. This data can be used to help identify potential areas for conservation. The data can be re-ranked to better reflect a smaller area, such as your town and the surrounding towns. Looking at the natural resources beyond your boundary is critical to protecting those within it. Highest ranked wildlife habitat maps can be found on the GRANIT website by searching “Wildlife Action Plan” on the New Hampshire Geodata Portal, and on GRANITView (GRANITView (unh.edu)) under the “Environment and Conservation”, “Wildlife”, and “Wildlife Action Plan” layers. For more information on this map, visit the habitat condition page.
Here is a Highest Ranked Wildlife Habitat by Ecological Condition Map for the town of Gorham. The pink is the highest ranked habitat in the state and the green is the highest ranked habitat in the biological region. This map can help prioritize potential areas for conservation.
SWAP Appendix D: Habitat and Species Crosswalk
Use this appendix to cross reference what species could be found in each habitat or which habitats could support one of the species. Remember that latitude, size of parcel, time of year, and other factors play an important role in whether or not a species will be found in a particular habitat. You can look at the distribution maps to see if a particular species might be in your area. Note that it might not be recorded from your town, but if it is in towns in your region, it could be in yours also. The 2015 SWAP only includes the 123 species of greatest conservation concern and therefore common species are not included in this crosswalk tool.
SWAP Appendix A: Species Profiles
You can to use the profiles to identify potential species on lands that have not had a detailed wildlife inventory. If you have done more detailed inventories, and have identified one of the 169 species of greatest conservation need from the SWAP, you can include information from the profiles to indicate what your community could do to help that species. You can also reference the profile and/or copy it into an appendix into your NRI document. Make sure to report your findings to the Wildlife Sightings Database so your data can be incorporated in the next version of SWAP maps as rare species information influences the Highest Ranked Wildlife Habitat and Conservation Focus Area Maps.
WAP Appendix B: Habitat Profiles
Use these profiles to better understand the habitats that occur in your town. You can identify some of the most significant habitat types and recommend management or protection strategies in your conservation plan. These can also be incorporated directly into your NRI.
WAP Chapters 4 and 5: Risks and Strategies
Most NRIs include suggestions for protecting the identified natural resources. Incorporate the wildlife risk summaries outlined in Chapter 4 and conservation strategies outlined in Chapter 5 into your NRI.